Spun yarn export falls in May, China imported lesser this month
YarnsandFibers News Bureau 2014-06-16 10:35:00 – MumbaiSpun yarn exports declined in May 2014 after jumping over 19 per cent in April in a year-on-year comparison. During the month 99 million kg of spun yarns were exported worth US$335 million or Rs 1,995 crore. In terms of growth, the volumes were down 6 per cent while US$ earnings fell 10 per cent implying a faster fall in unit price realization, and also the Rupee depreciated 11 per cent against the US$. Average unit price realization was US$3.39 /kg, down US cents 15 than the realization a year ago but up US cents 5 from previous month.
Spun yarns were exported to 85 countries in May with China topping the list with a share of close to 27 per cent. However, it has imported lesser yarn from India during the month. In May, exports to China declined 30 per cent YoY to US$89 million. Since May 2013, China’s import from India was hovering above US$100 million, at time even crossing US$200 million mark. In the first two months of 2014-15, its import has been sub-US$100 million mark. Bangladesh followed China, accounting for 12 per cent of all spun yarn exported from India. During the month, export to Bangladesh was up 14 per cent.
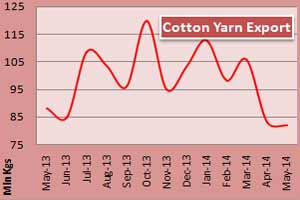
In May, cotton yarn worth US$280 million (Rs 1,680 crore) was exported to 74 countries with volumes aggregating 82 million kg, implying unit price realization of US$3.45 a kg on an average. This was US cents 15 down compared to same month a year ago. Combed cotton yarn accounted for 62 per cent of the all cotton yarn exported during the month with volumes at 45 million kgs. Carded yarn export was at 26 million kg. Their respective unit value realization was US$3.85 per kg and US$3.10 per kg. Open ended yarn export was at 7.8 million kg at an average price realisation of US$2.21 a kg. China and Bangladesh together accounted for 44 per cent of the total cotton yarn export while Vietnam, Egypt and Peru were the following major markets.
Export of spun yarns made of man-made fibre continued to moderate in May in value terms. A total of 6.95 million kg of man-made fibre spun yarns were exported during the month, comprising 2.60 million kg of viscose yarn, 2.24 million kg of polyester yarn and 0.75 million kg of acrylic yarn. Polyester yarn exports fell 35 per cent in value while viscose yarn exports in-creased 3.5 per cent during the month. Acrylic yarn jumped in value terms by 35 per cent with US$1.13 a kg jumped in unit value realisation.
Polyester spun yarn export was valued at US$5.9 million with a unit price realization of US$2.66 on an average. This was almost US cents 17 down from last year. Turkey was the largest market for Indian polyester spun yarn in May while Iran was the highest importer of viscose yarn followed by Belgium.
Blended spun yarn export aggregated 10.2 million kg valued at US$33 million, mainly comprising PC yarns worth US$16 million and PV yarns valued at US$10.6 million. Egypt was the largest importer of PC yarn from India followed closely by Colombia. Turkey was the largest importer of PV yarns in May, followed by Iran and USA.
Courtesy: YnFx ExportWatch Report – June 2014
Market Intelligence
Ask for free sample Report

experience
Customer Base
dedicated team
Countries Served Worldwide


